[MACROECONOMICS EXPLAINED] MacroEconomics/ Demand and Supply/ Circular Flow / PPC, All About With Graphs.
![[MACROECONOMICS EXPLAINED] MacroEconomics/ Demand and Supply/ Circular Flow / PPC, All About With Graphs.](https://blogger.googleusercontent.com/img/b/R29vZ2xl/AVvXsEgZoX-RT4EQUqI2zGrs5-oA_DkDir-l2XXBGg6RYvI1yCUGxwwQIc4CpjX711AOZIPtmUefUy4uxGKlXd5HcCY0hnH8iP1ChrKtt7urjKQ_NNCusEOul0Lih1UNiSeqsEIjHl9L0n9p0dlW/s400/macroeconomics.png)

What is Macroeconomics? What is The production possibilities curve (PPC)? What is Absolute Advantage and Comparative Advantage? What is The Circular Flow Model? The circular flow model Vocab. What is Demand and Supply Low and how its work?
The answer to all these questions is in this article and explain with the Graph Models, you are welcome to our blog #theEco.info
Economics subject it all starts the same for a basic introduction of economics, it's starting the idea of scarcity. Scarcity ideas we have unlimited wants and limited resources. You learn the idea of opportunity costs. That's the idea that everything has a cost or it doesn't matter what you're producing. You go to give up something to produce or any decision you make has a cost.
Defection of Economics – Social science that analyses the most efficient way to use our scarce resources.
Scarcity – We have unlimited wants but limited resources.
Opportunity Cost – Most desirable alternative given up when you make a choice.
Factors of Production – land, labour, capital.
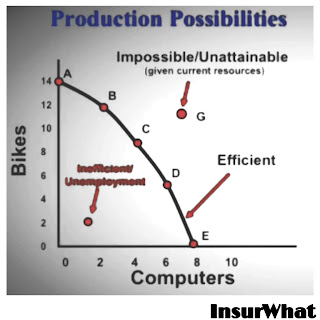
The graph shows the different combinations of producing two different goods using all of your resources so any point on the curve is efficient like you're using all of your resources to the fullest any point inside the curve is inefficient and a point out here outside the curve is impossible given your current resources.
The producer with the can produce the most output OR requires the least amount of inputs (resources).
Comparative Advantage
The producer with the lowest opportunity cost. Countries should trade if they have a relatively lower opportunity cost.
They should specialize in the good is ‘’cheaper’’ for them to produce.
Let’s explain compared advantage is the idea that country should specialize in the product, where they have a lower opportunity cost. so, if you're producing one thing and I'm producing something else if I can produce a lower opportunity cost than, I should produce this. you should present a thing and then we should trade. now there's two different things have to remember absolute advantage and comparative advantage. absolute advantage is a joke it's easy you just figure out who produces more if that means they have an absolute advantage. Compared advantage requires you do some calculations.
Now another thing you have to learn is that you have terms of trade, which means how many units of one product should they trade for the other product that wouldn't benefit both countries.
Public Sector – Part of the economy that is controlled by the government.
Factor Payments – Payments for the factor of production, namely rent, wages, interest, and profit.
Transfer Payments – When the government redistributes income (ex: welfare, social security)
Subsidies – Government payments to businesses.
There is an INVERSE relationship between price and quantity demanded.
Remember the demand is a downward sloping curve that shows when price goes up people buy less and stuff right when price goes down people buy more that's the idea price and quantity demanded.
The Low of Supply?
There is a DIRECT relationship between price and quantity supplied.
Now to microeconomics class you got a lot more details about the supply and demand graph, ceilings, floors and all sorts of crazy other stuff but you don't need to understand those concepts for most macroeconomics classes just understand where equilibrium comes from what happens when demand shifts right or left when supply shifts left or right and understand the idea of shortage and surplus that's usually enough.
that is all we have on this topic if you have any question please do write in the comment section below and do not forget to subscribe to our newsletter for more such great post have a great time ahead.
Defection of Economics – Social science that analyses the most efficient way to use our scarce resources.
Scarcity – We have unlimited wants but limited resources.
Opportunity Cost – Most desirable alternative given up when you make a choice.
Factors of Production – land, labour, capital.
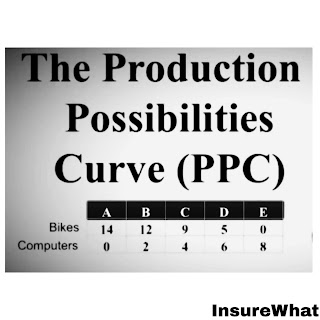
The Production Possibilities Curve (PPC).
Now those concepts come together with the production possibilities curve.The graph shows the different combinations of producing two different goods using all of your resources so any point on the curve is efficient like you're using all of your resources to the fullest any point inside the curve is inefficient and a point out here outside the curve is impossible given your current resources.
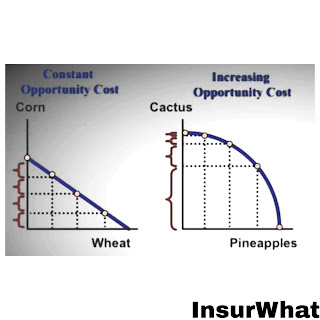
Constant Opportunity Cost and Increasing Opportunity Cost.
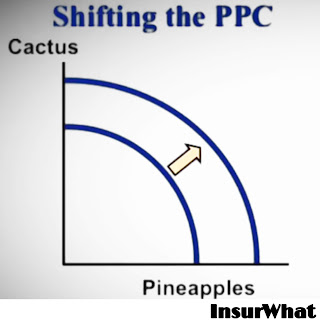
There are two different shapes you have to remember if it's a straight-line production possibilities curve that means there's constant opportunity costs which means the resources to produce the different products are very similar. If it's a boat outline concave to the origin that means that resources are not very similar so when you produce more of one to give the more and more of the other one that's called the law of increasing opportunity cost.Shifting the PPC
In this graph the curve can shift if you have more resources like land, labor and capital or less resources or better technology that can shift the curve. Another thing that shifts a curve is train if another country trades with another country that can shift out their production possibilities curve. But it shows how much they can consume not actually produced.Absolute and Comparative Advantage.
Absolute advantageThe producer with the can produce the most output OR requires the least amount of inputs (resources).
Comparative Advantage
The producer with the lowest opportunity cost. Countries should trade if they have a relatively lower opportunity cost.
They should specialize in the good is ‘’cheaper’’ for them to produce.
Let’s explain compared advantage is the idea that country should specialize in the product, where they have a lower opportunity cost. so, if you're producing one thing and I'm producing something else if I can produce a lower opportunity cost than, I should produce this. you should present a thing and then we should trade. now there's two different things have to remember absolute advantage and comparative advantage. absolute advantage is a joke it's easy you just figure out who produces more if that means they have an absolute advantage. Compared advantage requires you do some calculations.
Terms of Trade.
Both countries can benefit from trade if they each have relatively lower opportunity coasts. Terms of trade – The agreed upon conditions that would benefit both countries.Now another thing you have to learn is that you have terms of trade, which means how many units of one product should they trade for the other product that wouldn't benefit both countries.
EX: Trade 1 ton of wheat for 1.5 tons of sugar.
The Circular Flow Model.
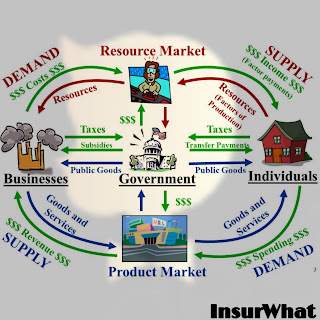
The circular flow model shows you that there's businesses and individuals and the government how they interact with each other just remember businesses both sell and buy two different things they sell products and they buy resources so there's a product market and there's a resource market and individuals you and me we buy products and we sell our resources and the government does some stuff as well.The circular flow model Vocab
Private Sector – Part of the economy that is run by individuals and businesses.Public Sector – Part of the economy that is controlled by the government.
Factor Payments – Payments for the factor of production, namely rent, wages, interest, and profit.
Transfer Payments – When the government redistributes income (ex: welfare, social security)
Subsidies – Government payments to businesses.
Demand and Supply
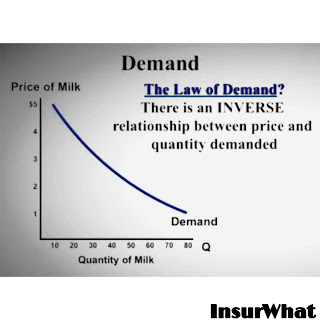
The Low of Demand?There is an INVERSE relationship between price and quantity demanded.
Remember the demand is a downward sloping curve that shows when price goes up people buy less and stuff right when price goes down people buy more that's the idea price and quantity demanded.
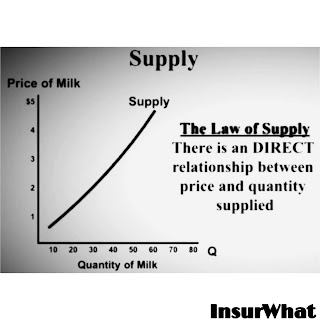
The Low of Supply?
There is a DIRECT relationship between price and quantity supplied.
There's also a lot of supply when the price goes up people produce more price goes down people produce less right price goes up quantity supply goes up price goes down quantity supply goes down.
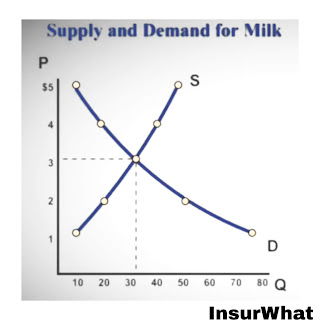
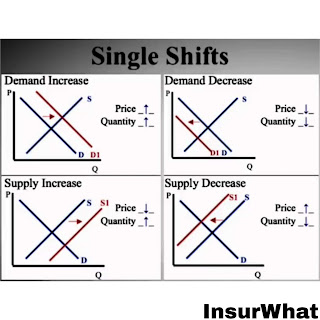
Now together they formed equilibrium. If price goes up there is no shift price does not shift the curve it just moves along the curve creates either shortage when the price is low or a surplus from the price is higher.
You should also understand there's actual individual shifts. So, there's only four things that the demand can go up the demand can go down and supply can go up or a supply can go down. You just watch the graph, draw the graph, tells you exactly happens the price in quantity every single time.Now to microeconomics class you got a lot more details about the supply and demand graph, ceilings, floors and all sorts of crazy other stuff but you don't need to understand those concepts for most macroeconomics classes just understand where equilibrium comes from what happens when demand shifts right or left when supply shifts left or right and understand the idea of shortage and surplus that's usually enough.
that is all we have on this topic if you have any question please do write in the comment section below and do not forget to subscribe to our newsletter for more such great post have a great time ahead.
Get Interesting Articles Every Day!
- Get interesting knowledge you probably never knew before
- Be the first to know about new things in the World of Business


0 Response to "[MACROECONOMICS EXPLAINED] MacroEconomics/ Demand and Supply/ Circular Flow / PPC, All About With Graphs."
Post a Comment
Please Attention Before Commenting